On 13th October, The Sunday Times published its annual rankings of British and Irish Universities. The management of The Institute (the place where I work) promptly printed dozens of posters announcing its designation as Institute of Technology of the Year 2014 (huzzah huzzah). That's okay, the management are not necessarily trained in Science and even if they are, their skills lie elsewhere. Margaret Thatcher, for example, was trained as a chemist but preferred to run a country - more of a challenge. Management can quite legitimately preen themselves a bit and retweet any positive publicity - it's their job. There was, I am glad to say, more healthy skepticism and even bemusement amongst my scientific colleagues: how-in-heck did we get the top accolade if, by the ST's own criteria, four other ITs were better?
The criteria used by the Sunday Times were six in number, but they chose to weight Leaving Certificate points 2.5x more than the other parameters (why? It is not explained):
- Median Leaving Cert Points obtained by incoming honours degree students (wt 250)
- Research funding (not research impact) got in 2012 / FTE staff (wt 100)
- % of students employed nine months after graduating (wt 100)
- % of high quality (1st/2.1) degrees awarded (wt 100)
- Student/Staff ratio (wt 100)
- % of students who had completed their degrees within 5 years of starting (wt 100)
The ST acknowledges that TCD's 4% lead is being eroded as the hungry pack champ at the heels of the alpha University. Here you can see that UCD is 'better' at research than TCD:
| Uni | LC | Res | Emp | 1st | St/St | Comp | Total |
| TCD | 215 | 84 | 93 | 73 | 60 | 81 | 606 |
| UCD | 198 | 93 | 94 | 62 | 60 | 78 | 583 |
| Ratio | 1.09 | 0.90 | 0.99 | 1.18 | Same | 1.04 | 1.04 |
*skeptic alert: the following analyses compare the average values of X and the average value of Y and ignore the range and error-of-estimate associated with that single tweetable metric. Within TCD, for one example, when I was a watch-keeping non-comm on the bridge of SS Genetics, we were extremely parsimonious with handing out Firsts and used to snicker at Zoology (whose students we regarded as affable rugger-playing bohunks looking at things-bigger-than-a-breadbox through binoculars) who awarded a generous handful of these precious certificates each year.
The other criteria are in some sense uncorrelated with each other. But if the quality of the degree means anything in these straightened times, it is that it gets you a (better) job. Those two parameters should show some sort of relationship. And they do . . . not. Only with the eye of faith and by illegitimately eliminating the extraordinarily good employment record achieved by IT-The-Blanch (in the bottom right corner) is there an upward slope here. The Correlation Coefficient (r) - a measure of association between two variables (1 = perfect positive correlation, 0 = two completely unrelated variables) = 0.11 which is, as we say, not significant. So the proportion of 'good' degrees awarded is an institution-internal metric only hazily associated with the objective quality of the students winning them. Let's accordingly eliminate that criterion as subjective and irrelevant. As TCD showers out 1st Class Honours degrees like confetti, under this rule TCD (and UCD) are knocked out by UCC which had champion research results. By tricking about with the data in this way you can make any one of the top 4 or 5 Universities become Best University.
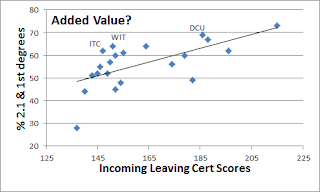
Now here's a metric that might serve to identify the colleges that do more than sit on their hands for four years while their students party. There is a wide discrepancy between average incoming Leaving Cert score but a pretty good correlation (r = 0.64) between that and % 'good' degrees awarded. (Taking the latter with a pinch of salt as discussed in the previous paragraph). So you'd be looking for those institutions that fall above the trend line in the graph on the left. These include Waterford and Carlow ITs and Dublin City University. These institutions appear to take kids from school at one level and spit them out four years later a little higher up the hill.
Mais revenons nous a nos data. On p.5 of the 13/Oct/13 Sunday Times Colour Supplement that reports all these findings, you can see the data from which my table and graphs are abstracted. They claim that for DCU (ranking 4th) 186+68+94+69+64+83=583 but it doesn't. It sums to 582. What differ you may cry? It's only 2 parts in 1000 off. It differs, sunshine, because if the Sunday Times can't add up a row of numbers correctly, there are likely to be other more substantive errors elsewhere in their report. So I can (Greenhalgh rules okay) dismiss the whole thing as lazy, irresponsible, arbitrary and tendentious nonsense.
I want TCD to win and my own employer did win, but it's still nonsense.


Attended an interesting seminar in Tipp yesterday in which Kathleen Lynch Prof of Equality Studies in UCD gave a very similar conclusion to the process of ranking universities, but from a sociological perspective
ReplyDelete